imports and setup
import sys
from pathlib import Path
module_dir = Path(".").resolve()
sys.path.append(str(module_dir))
import osmnx as ox
from network_explorer import BikeNetworkExplorerimport sys
from pathlib import Path
module_dir = Path(".").resolve()
sys.path.append(str(module_dir))
import osmnx as ox
from network_explorer import BikeNetworkExplorerOn a trip to Copenhagen, I biked in a city for the first time in a decade. It was delightful and liberating, and it made sense that the majority of Copenhagen residents primarily commuted by bike. Returning home to Chicago, I bought a bike and quickly felt the difference that bike infrastructure and culture makes.
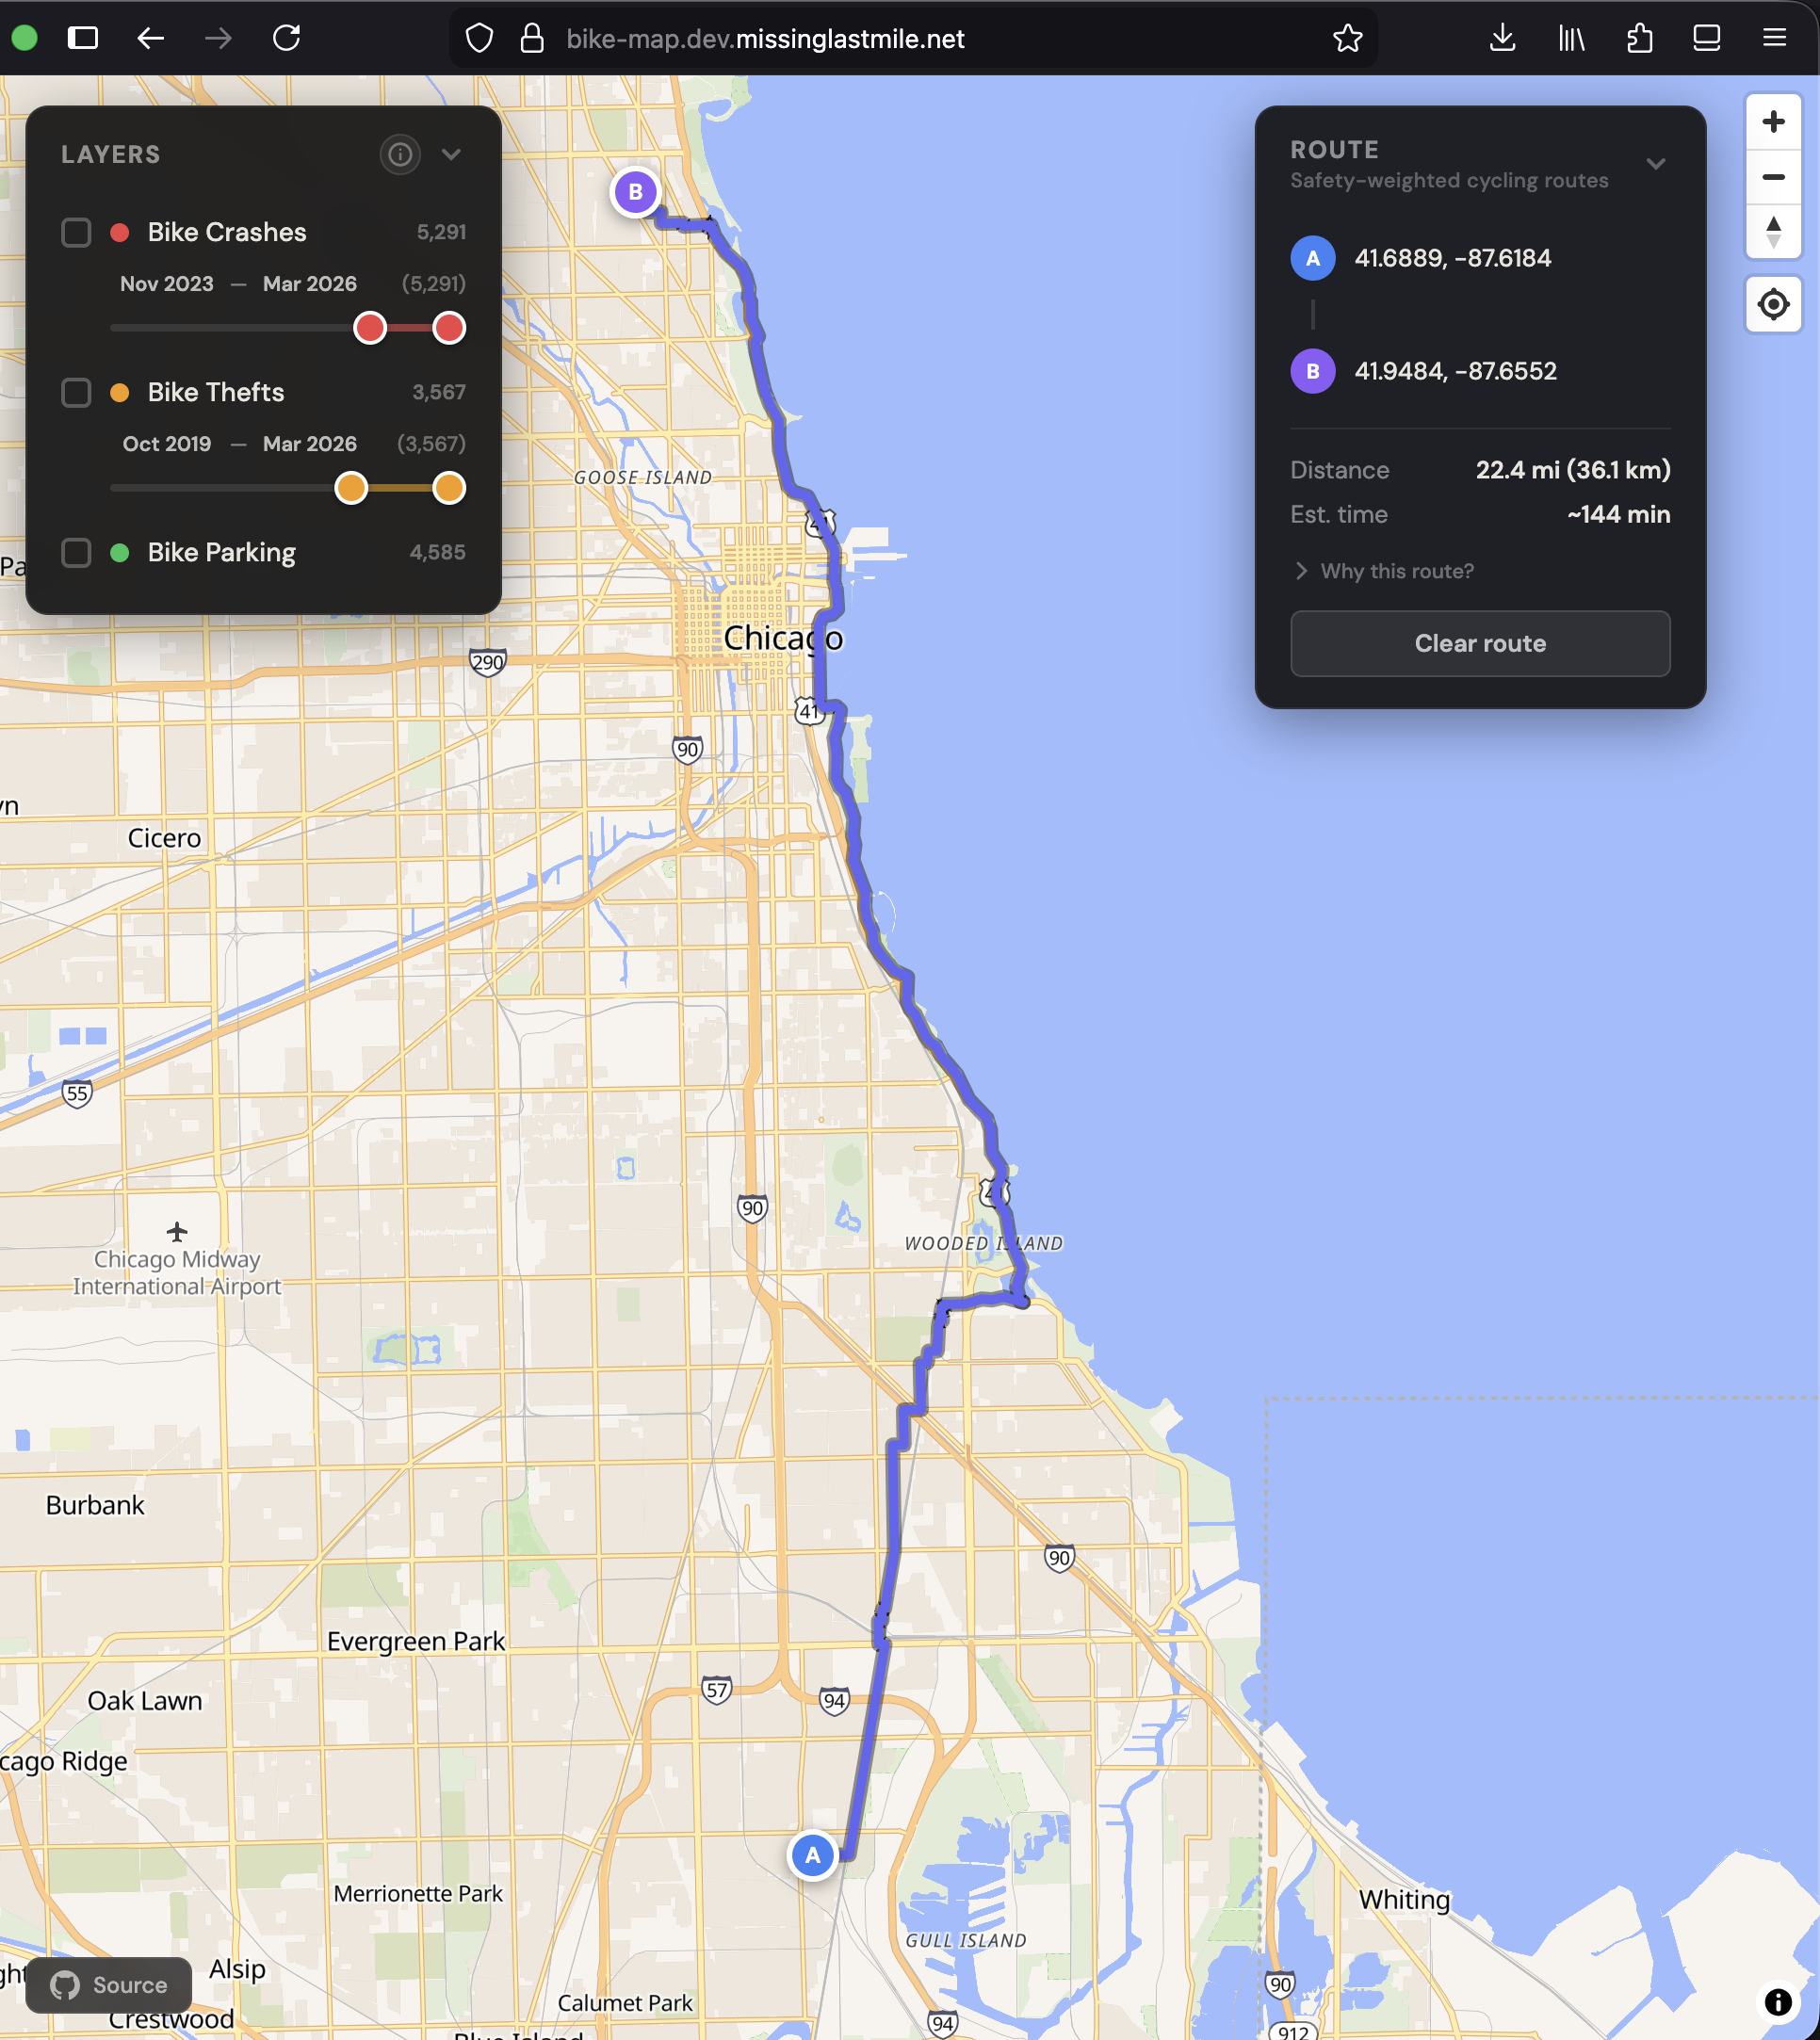
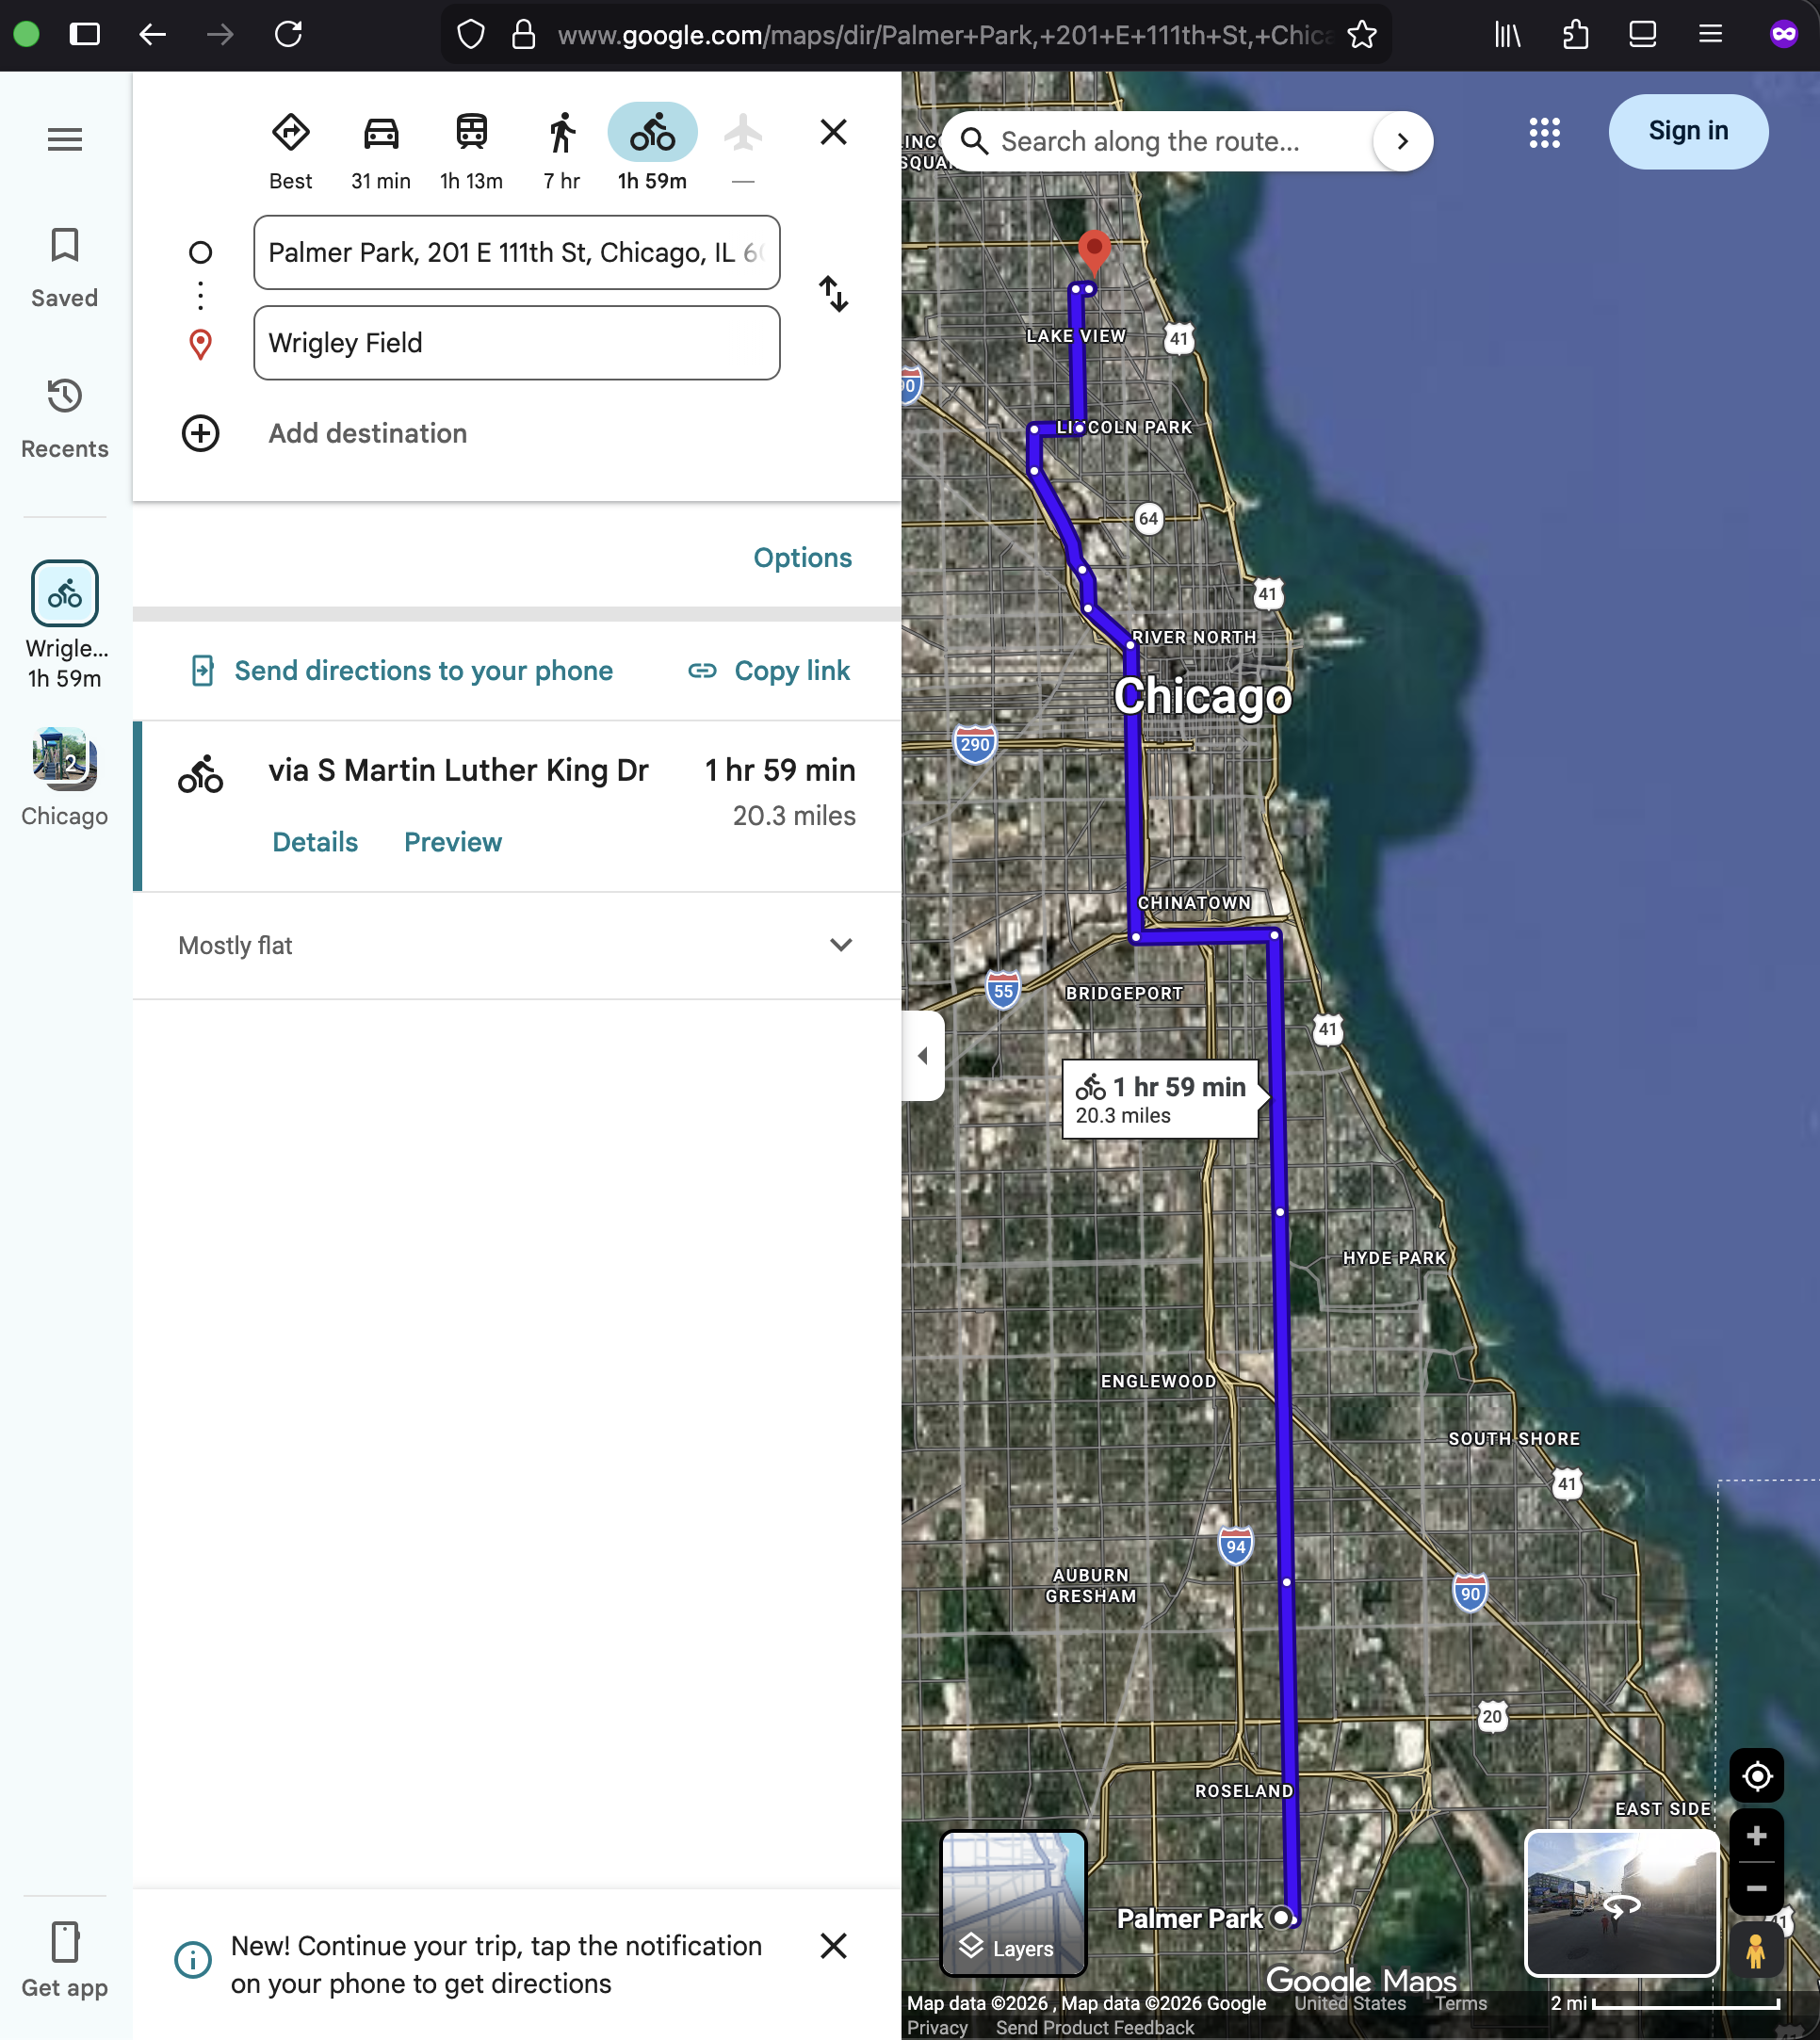
In Copenhagen, bike safety and bike theft were basically solved problems. Extensive infrastructure made routes everywhere safe to bike and from the number of unlocked bikes, it was clear that bike theft wasn’t an issue. Back in Chicago, I was sharing lanes with cars going 40 mph and despite extensive locking and uglying up my bike, I still never knew if my bike would still be there. The gap between those two experiences stuck with me. Over time I’ve learned safer, more comfortable routes, and Chicago keeps building out new infrastructure, but you wouldn’t know about these better ways from the existing popular routing tools (see the images below). So I built a tool to help find the safer routes and find secure parking areas, the missing last mile issues that keep people from biking.
You can try it at chicago.bikeinfra.com.
You already have an intuition for how routing works.
Think about a route you ride or drive regularly. At each intersection, you know which way to go. You haven’t evaluated every possible path through the city, but you can tell which options move you toward your destination and which ones don’t. You don’t consider turning away from where you’re going unless you have a good reason, like avoiding a busy street or getting over a bridge.
In computer science jargon, a street grid is called a graph (or network); a set of intersections connected by roads. Each intersection is a node, each road segment between intersections is an edge, and each edge has a cost — whatever you’d “pay” by traveling down that segment. Cost could be distance, time, effort, risk, unpleasantness; it could be anything, you just have to be able to represent it with positive numbers.
The routing algorithm I use, A* (pronounced “A star”), works the same way. It starts at the starting intersection, looks at the road segments it could go down, and for each one asks: how much did it cost to get here, how much does it cost to go down this road segment, and how far would I be from the destination? It picks the option where that total is lowest and repeats the process. This means it naturally favors direct routes, but it’s willing to explore less direct paths if the cost of the direct route is high enough, which is exactly what you want when “cost” means danger instead of distance.
Here’s what a few blocks of Chicago’s actual bike network look like as a graph:
west = -87.6620; south = 41.8968; east = -87.6423; north = 41.9113
goose_island_graph = ox.graph_from_bbox(
bbox=(west, south, east, north), network_type="bike", retain_all=True
)
goose_island_explorer = BikeNetworkExplorer(goose_island_graph)
goose_island_explorer.show()Every line on that map is a bicycle-relevant edge in the OpenStreetMaps data, and every dot where lines intersect is a node. Different colors indicate disconnected subnetworks (most of the edges belong to one large connected network, which is what makes routing possible). Clicking on any node or edge will provide more detail about that element.
A routing algorithm can find a path through this network from an origin node to a destination node that minimizes some total cost. The key insight is that cost can be anything. When Google Maps routes you, the cost on each edge is usually travel time or distance. When my app routes you, the cost is a safety score, which is a number that estimates the risk a cyclist takes on each road segment. The algorithm doesn’t know what the number represents; it just finds the path where the numbers add up to the smallest total. If those numbers accurately reflect risk, the cheapest path is the safest path.
So how do you turn messy real-world data into an accurate risk score for each road segment?
This is the interesting question at the heart of the project. Google Maps and other routing tools optimize for time or distance. Some have basic bike modes that prefer bike lanes when they exist. But none of them let you define what “safe” means to you, or plug in local crash data to inform the route.
I wanted to combine several factors:
Each road segment gets a cost that estimates the risk of riding down that segment, and the routing algorithm finds the path with the lowest total score — the safest route, not the shortest one.
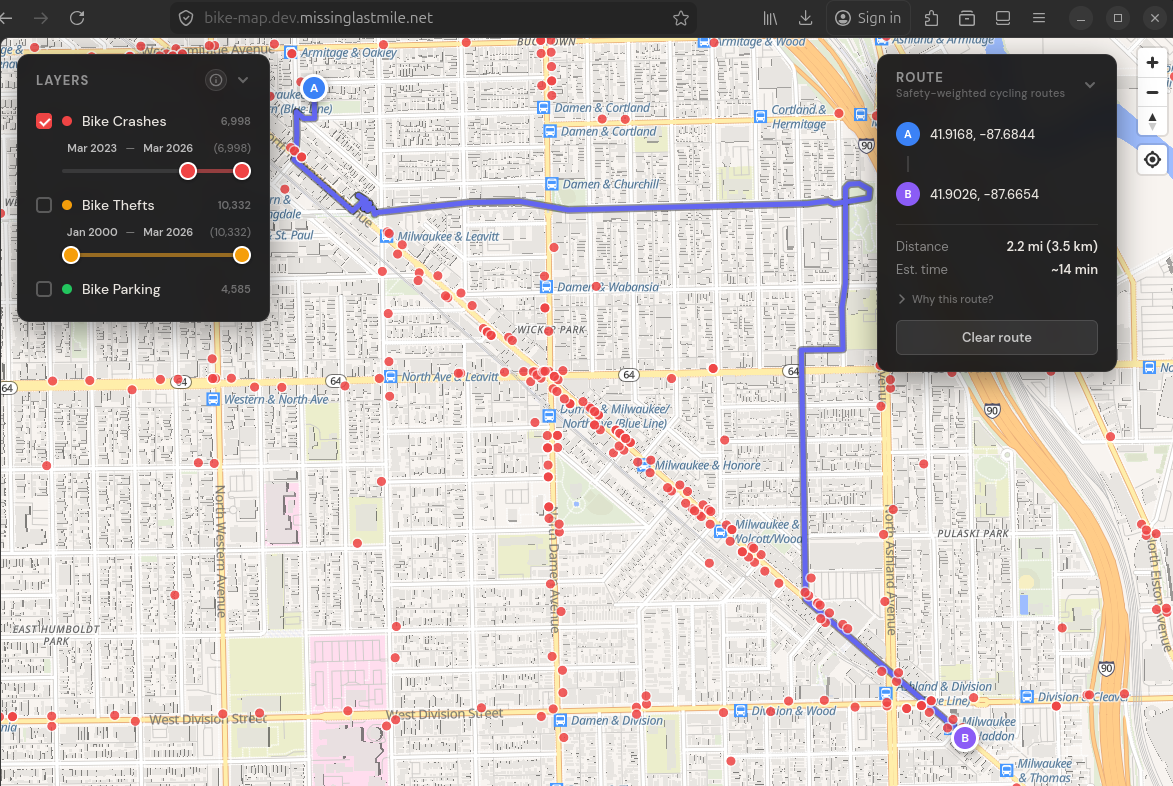
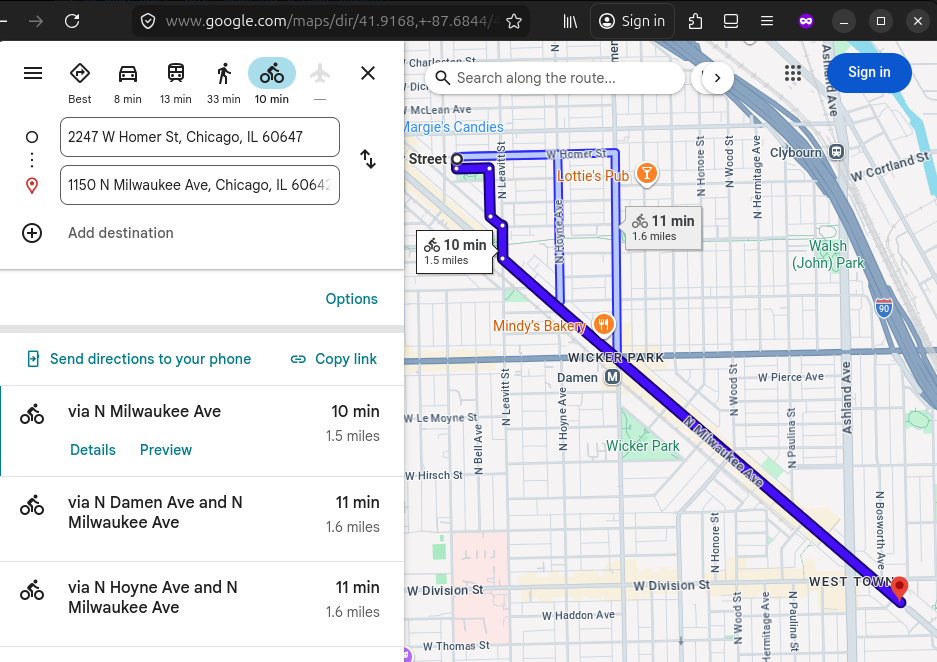
Here’s a concrete example of how the safety-weighted routes differ from distance or time weighted routes. The safety-weighted route on the left avoids a dangerous stretch of Milwaukee Ave (where there have been over 60 recent CPD-recorded crashes involving a cyclist) by sending the cyclist onto dedicated cycling infrastructure (the Bloomingdale trail). The Google Maps routes send the cyclist through a very unsafe and uncomfortable intersection and onto high crash stretch of Milwaukee.
Route differences like these tell me the cost model is having the intended effect: the algorithm will choose slightly longer routes via low risk segments rather than slightly shorter routes via higher risk segments.
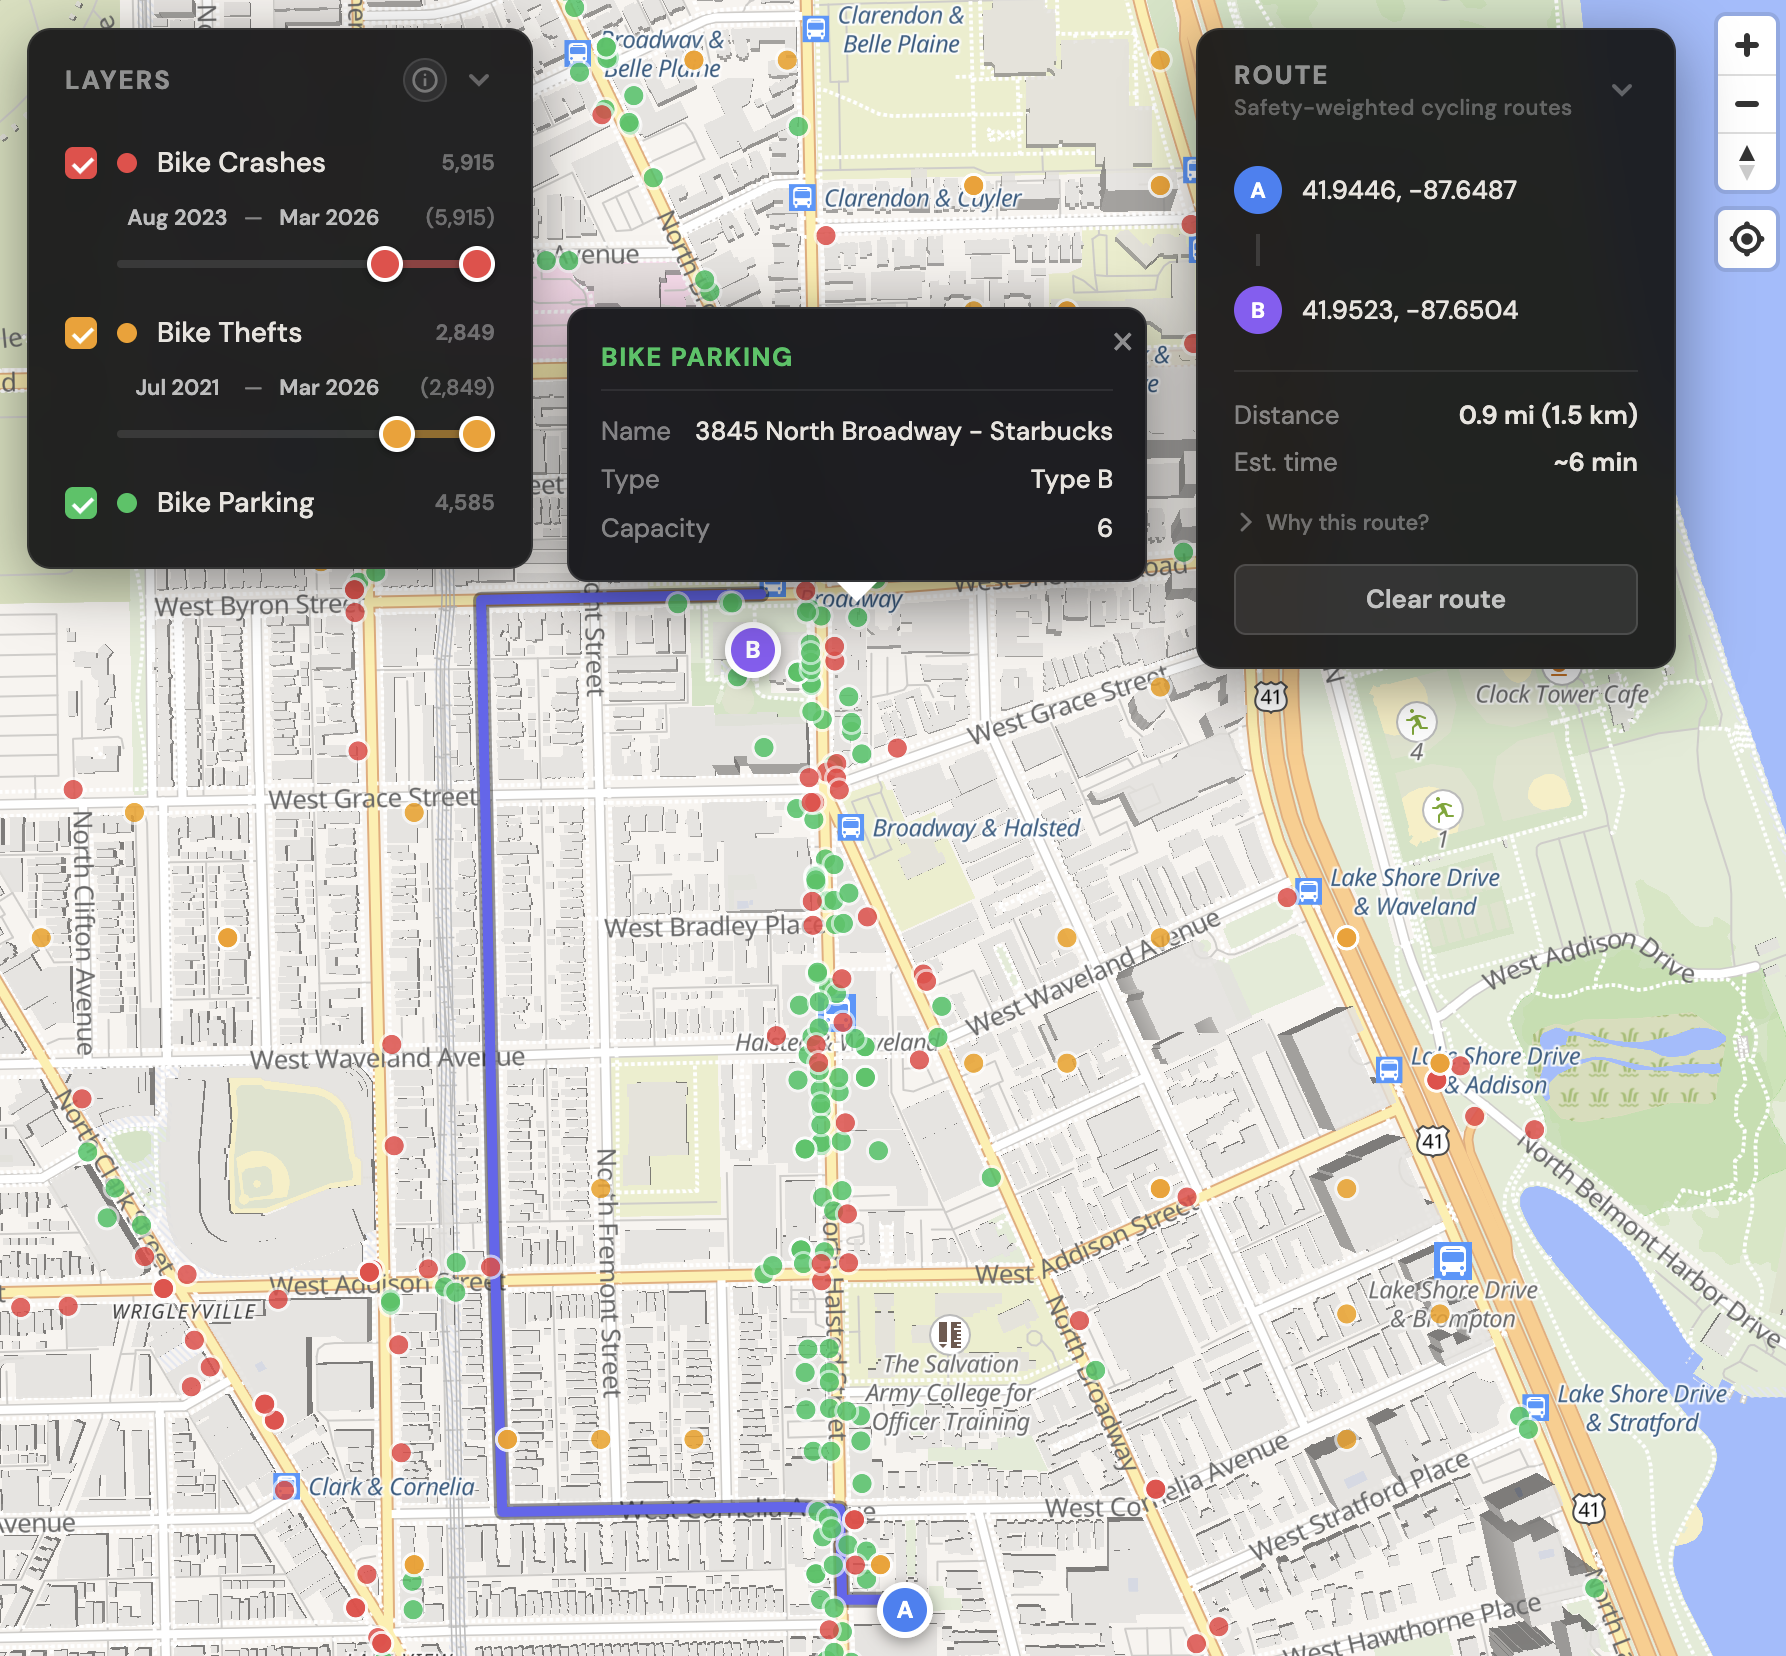
The routing gets the most attention, but the data layers might be more useful day-to-day. The app shows where bike thefts are concentrated and where the city’s bike parking fixtures are. Before I ride somewhere I haven’t been, I check whether there’s a reasonable place to lock up. That’s the Copenhagen problem I can’t solve, but at least now I can make informed decisions about.
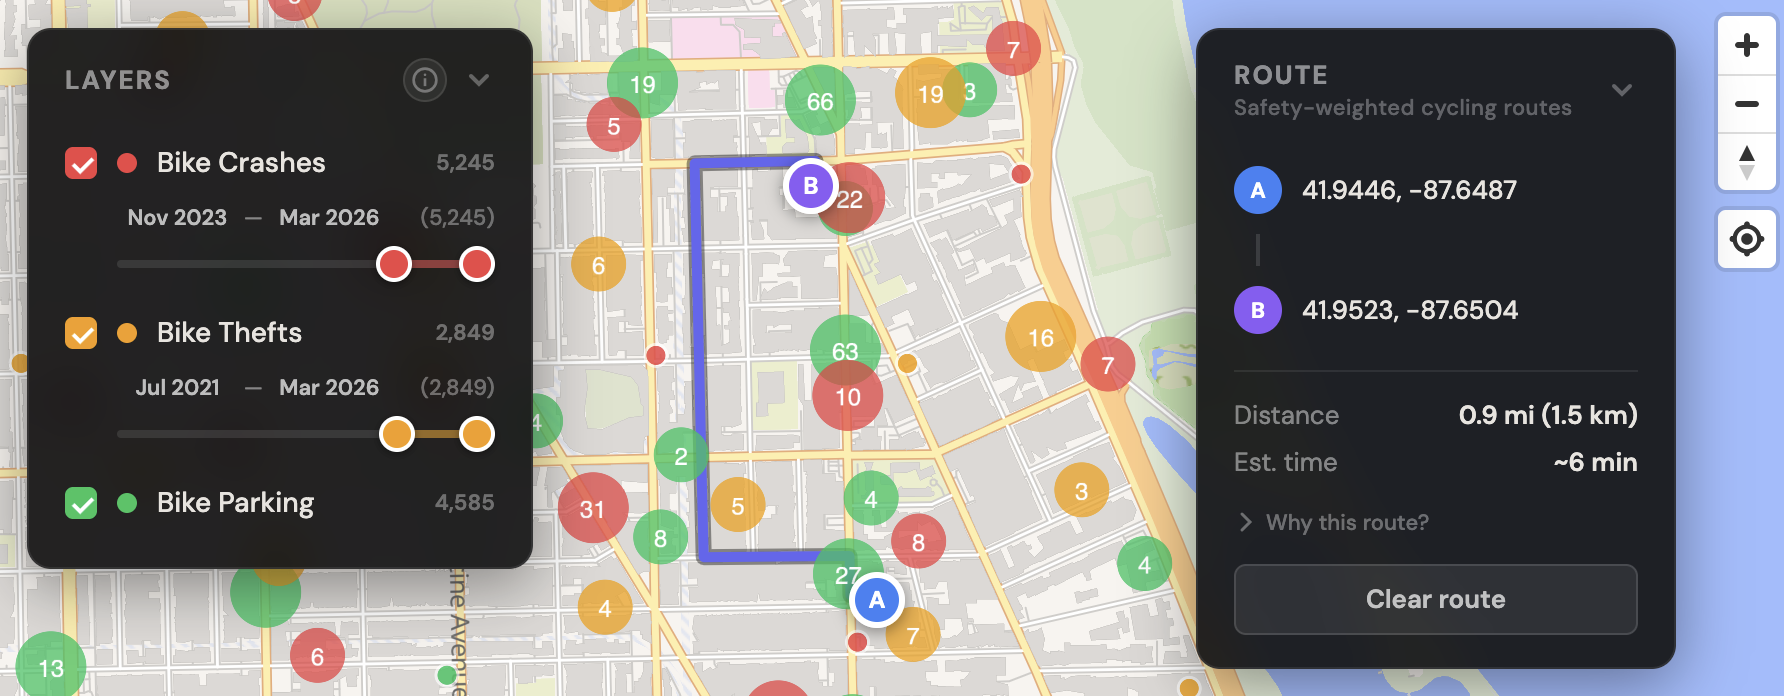
Notice how the route goes three blocks west to travel north on a residential street with no crashes instead of the shorter route straight north on Halsted (over a four block span with ~20 CPD-recorded crashes over the past three years).
The platform pulls road network data from OpenStreetMap, crash and infrastructure data from the City of Chicago’s open data portal, and bike parking locations. That data is transformed using dbt into safety-weighted costs for every road segment, exported as a graph, and served by an AWS Lambda function that runs A* pathfinding on request. Excluding the $17/year custom domain, the whole thing costs $0.00/month to operate.
I’ll dig into the technical details in future posts that cover things like:
The app is live at chicago.bikeinfra.com. Pick two points in Chicago and see what route it suggests. Toggle the crash and theft layers to see how risk is distributed across the city.
If you ride in Chicago, I have a question: what’s a route you’ve figured out the hard way — one where you learned to avoid a particular street or take a specific detour? I’m curious whether the app finds the same route. That kind of local knowledge is exactly what helps me tune the model.