The majority of code and analysis in this post was originally written back in mid-2018 (in this notebook). I’ve consolidated some cells, automated data retrieval, and added cell labels to make things render nicely, but otherwise I’ve left the work as-is. Compared to my current work products, this old code is very messy and unpolished, but like Eric Ma (creator of the networkx graph data analysis package), I believe in showing newer data analysts and scientists I mentor that no one in this field started off with mastery of git, pandas, bash, etc, and that everyone who lasts loves to keep learning and improving.
After I integrate these old posts into this blog, I’ll write an EDA post that starts from scratch using up-to-date data.
1 Criminal Justice and Corrections Data EDA, Part 2
As in part 1, I’m exploring the most recent data from the Bureau of Justice Statistics’ Prisoner Series datasets.
3 Imprisonment Counts and Rates by State (Table p16t02)
In the previous post, Exploratory Data Analysis Part 1, we saw that the vast majority of people in prisons are in state prisons, but we didn’t discover anything about imprisonment rates in individual states. One of my favorite tools for examining geographical data is the choropleth map (which you may recognize from any recent election night). In this post, I use the Bokeh python package to generate some state-level choropleths to show rates of imprisonment and how they vary from state to state.
Scroll to the bottom if you want to jump straight to the maps.
Imports, styling, path definitions, and util funcs
Loading and preprocessing the t02 dataset, Counts by State and Gender
# Breakdown by State and Gender (Table p16t02)CSV_PATH = os.path.join(PRISON_DATA_DIR, 'p16t02.csv')state_sex_df = pd.read_csv(CSV_PATH, encoding='latin1', header=[11,12], na_values=':', thousands=r',')print(f"Initial data format")display(state_sex_df.head())state_sex_df.dropna(axis=0, thresh=5, inplace=True)state_sex_df.dropna(axis=1, thresh=5, inplace=True)# state_sex_df.dropna(axis=0, inplace=True)state_sex_df.drop(['Percent change, 20152016', 'Unnamed: 12_level_0','Unnamed: 14_level_0'], axis=1, inplace=True)state_sex_df.drop([0,1,2], axis=0, inplace=True)# Fixing the headers for the dataframetmp1 = ['Area']tmp1.extend(3*[state_sex_df.columns.values[1][0]])tmp1.extend(3*[state_sex_df.columns.values[4][0]])tmp2 = [el[1] for el in state_sex_df.columns.values]tmp2[0] =''state_sex_df.columns = pd.MultiIndex.from_arrays([tmp1,tmp2], names=['', ''])state_sex_df.reset_index(drop=True, inplace=True)# To clean up the '/_' footnote indicatorsfix =lambda x: x.split('/')[0]state_sex_df['Area'] = state_sex_df['Area'].apply(fix)# This creates a new column in the DataFrame with the state code for each statestate_code = get_state_code()map_state_codes =lambda x: state_code[x]state_sex_df['Code'] = state_sex_df['Area'].apply(map_state_codes)state_sex_df.drop(['Area'], axis=1, inplace=True) # drops the row with aggregated values# This sets the state code as the indexstate_sex_df.set_index('Code', inplace=True)# This fixes the names of the columns (to facilitate merging later)state_sex_df.columns.set_names([None,'SEX'], inplace=True)state_sex_df.index.name ='Code'print(f"\n\nData format after preprocessing")display(state_sex_df.head())
Initial data format
Data format after preprocessing
Unnamed: 0_level_0
Unnamed: 1_level_0
2015
Unnamed: 3_level_0
Unnamed: 4_level_0
Unnamed: 5_level_0
2016
Unnamed: 7_level_0
Unnamed: 8_level_0
Unnamed: 9_level_0
Percent change, 2015–2016
Unnamed: 11_level_0
Unnamed: 12_level_0
Unnamed: 13_level_0
Unnamed: 14_level_0
Unnamed: 15_level_0
Jurisdiction
Unnamed: 1_level_1
Total
Male
Female
Unnamed: 5_level_1
Total
Male
Female
Unnamed: 9_level_1
Total
Unnamed: 11_level_1
Male
Unnamed: 13_level_1
Female
Unnamed: 15_level_1
0
NaN
U.S. total/a
1526603.00000
1415112.00000
111491.00000
nan
1505397.00000
1393975.00000
111422.00000
nan
-1.40000
%
-1.50000
%
-0.10000
%
1
Federal/b
NaN
196455.00000
183502.00000
12953.00000
nan
189192.00000
176495.00000
12697.00000
nan
-3.70000
%
-3.80000
%
-2.00000
%
2
State/a
NaN
1330148.00000
1231610.00000
98538.00000
nan
1316205.00000
1217480.00000
98725.00000
nan
-1.00000
%
-1.10000
%
0.20000
%
3
NaN
Alabama
30810.00000
28220.00000
2590.00000
nan
28883.00000
26506.00000
2377.00000
nan
-6.30000
NaN
-6.10000
NaN
-8.20000
NaN
4
NaN
Alaska/c
5338.00000
4761.00000
577.00000
nan
4434.00000
4024.00000
410.00000
nan
-16.90000
NaN
-15.50000
NaN
-28.90000
NaN
/home/matt/miniconda3/envs/prisons_post_env/lib/python3.6/site-packages/pandas/core/generic.py:3812: PerformanceWarning: dropping on a non-lexsorted multi-index without a level parameter may impact performance.
new_axis = axis.drop(labels, errors=errors)
2015
2016
SEX
Total
Male
Female
Total
Male
Female
Code
AL
30810.00000
28220.00000
2590.00000
28883.00000
26506.00000
2377.00000
AK
5338.00000
4761.00000
577.00000
4434.00000
4024.00000
410.00000
AZ
42719.00000
38738.00000
3981.00000
42320.00000
38323.00000
3997.00000
AR
17707.00000
16305.00000
1402.00000
17537.00000
16161.00000
1376.00000
CA
129593.00000
123808.00000
5785.00000
130390.00000
124487.00000
5903.00000
In the above cell, I’ve cleaned up the DataFrame so that the column header now consists of: * column labels: (‘2015’, ‘2016’, ‘Total’, ‘Male’, ‘Female’) * column label names: (’‘, ’SEX’) * index name: (’Code)
Setting variables to help style plots and locate tooltips
# The color levels to use in the mapCOLORS = ['#feedde', '#fdd0a2', '#fdae6b', '#fd8d3c', '#f16913', '#d94801', '#8c2d04']state_xs = [states[code]["lons"] for code in states]state_ys = [states[code]["lats"] for code in states]
One of the great things about coding in Jupyter Notebooks is that I can prototype things as I go, and then encapsulate that prototype into a function. I built the prototype for my visualization in the cell below, and after I tune the visualization, I can make it into a function and easily generate more visualizations.
From this map, we see that the most populated states have the most prisoners (you can see the actual number of people in prison by hovering the mouse over a state). That’s approximately what we would expect, but it doesn’t really help us answer questions about the differences in imprisonment rates between States (with different policies on criminal justice). This information is useful for investigating some questions (e.g. Where could prison reform impact the most lives?), but it’s not as useful if we’re investigating the relationship between policies, crime rates, and imprisonment rates. If we want to actually compare imprisonment rates between states, we need to normalize (or scale) the prisoner counts to the population of the state. This requires getting a different data set.
3.1.1 Population Dataset
The US Census tracks and publishes population data, including a data set that tracks estimates of annual state populations (by gender) from 2010 to 2016. I’ll use this data to normalize the raw prisoner counts by state.
Loading and preprocessing the Census State and Gender pop. estimates
state_pop_sex_df = pd.read_csv(pop_file_path, encoding='latin1', header=0)print('\nRaw Population Data Set Format')display(state_pop_sex_df.head())state_pop_sex_df = state_pop_sex_df[state_pop_sex_df['SEX'].isin([1,2])]state_code = get_state_code()map_state_codes =lambda x: state_code[x]fix_sex =lambda x: 'Male'if x ==1else'Female'state_pop_sex_df['SEX'] = state_pop_sex_df['SEX'].apply(fix_sex)state_pop_sex_df.drop(['SUMLEV','REGION','DIVISION','STATE','AGE', 'ESTBASE2010_CIV', 'POPEST2010_CIV', 'POPEST2011_CIV','POPEST2012_CIV', 'POPEST2013_CIV', 'POPEST2014_CIV'], axis=1, inplace=True)state_pop_sex_df.rename({'POPEST2015_CIV':'2015_pop','POPEST2016_CIV':'2016_pop'}, axis=1, inplace=True)state_pop_sex_df['Code'] = state_pop_sex_df['NAME'].apply(map_state_codes)state_pop_sex_df = state_pop_sex_df.groupby(['SEX', 'Code']).sum()state_pop_sex_df = state_pop_sex_df.unstack(0)print('\n\nPopulation Data Set Format After Reformatting')state_pop_sex_df.head()
Raw Population Data Set Format
Population Data Set Format After Reformatting
SUMLEV
REGION
DIVISION
STATE
NAME
SEX
AGE
ESTBASE2010_CIV
POPEST2010_CIV
POPEST2011_CIV
POPEST2012_CIV
POPEST2013_CIV
POPEST2014_CIV
POPEST2015_CIV
POPEST2016_CIV
0
10
0
0
0
United States
0
0
3944160
3951400
3963239
3926677
3931346
3955374
3975414
3970145
1
10
0
0
0
United States
0
1
3978090
3957847
3966617
3978101
3943114
3950083
3974980
3995008
2
10
0
0
0
United States
0
2
4096939
4090856
3971363
3980016
3992752
3959663
3967361
3992154
3
10
0
0
0
United States
0
3
4119051
4111929
4102483
3982920
3992660
4006960
3974468
3982074
4
10
0
0
0
United States
0
4
4063186
4077557
4122286
4112795
3994261
4005464
4020276
3987656
2015_pop
2016_pop
SEX
Female
Male
Female
Male
Code
AK
697258
734122
701214
739176
AL
4998694
4681748
5011344
4687956
AR
3028428
2916226
3039182
2926812
AZ
6854628
6744392
6970496
6853282
CA
39205974
38470174
39466330
38716576
Now that I’ve reformatted the population data to match the format of the state prisoner counts, I want to merge these two DataFrames together so that I can calculate the normalized rates of imprisonment.
Joining state pop. estimates with state inmate counts
Now that I’ve merged the state prisoner counts with population data, I have to divide male prisoner counts by state population (of that gender) and store that information for use later.
Engineering per-capita inmate count features
# This Cell normalizes prisoner counts to be per 100k# state population for that year.yrs = ['2015','2016']sexes = ['Male','Female']for yr in yrs:for sex in sexes: state_sex_join_df.loc[:,(yr, sex +'_rate')] =\ state_sex_join_df.loc[:,(yr, sex)]\ .divide(state_sex_join_df.loc[:,(yr +'_pop', sex)]/100000)display(state_sex_join_df.head(3))
2015
2016
2015_pop
2016_pop
2015
2016
SEX
Total
Male
Female
Total
Male
Female
Female
Male
Female
Male
Male_rate
Female_rate
Male_rate
Female_rate
Code
AL
30810.00000
28220.00000
2590.00000
28883.00000
26506.00000
2377.00000
4998694
4681748
5011344
4687956
602.76632
51.81353
565.40633
47.43239
AK
5338.00000
4761.00000
577.00000
4434.00000
4024.00000
410.00000
697258
734122
701214
739176
648.52981
82.75273
544.38997
58.47002
AZ
42719.00000
38738.00000
3981.00000
42320.00000
38323.00000
3997.00000
6854628
6744392
6970496
6853282
574.37349
58.07755
559.19193
57.34169
Encapsulating Bokeh Choropleth Plotting code in a function
# I'm going to generate more choropleths, so I'll encapsulate the code# I prototyped above into this function.def make_choropleth(df, level1, level2, title, colors=COLORS):"""Generates a choropleth with tooltips Args: df: The DataFrame containing the relevant data. df should be formatted such that it has a 2 level column-header level1: The top column-header name (eg '2015' in examples above) level2: The next-lower column header name (eg 'Male) title: A title for the Choropleth colors: An ordered list of color codes to use in mapping data. """ state_names = [] data = [] min_val = df.loc[:,level1][level2].min() max_val = df.loc[:,level1][level2].max() bins =len(colors) TOOLS ="pan,wheel_zoom,reset,hover,save"for state_code in states:try: num_imprisoned = df.loc[state_code,level1][level2] state_names.append(state_code) data.append(num_imprisoned)exceptKeyError: state_names.append(' ') data.append(0)# Loading up Bokeh's special data structure source = ColumnDataSource(data=dict( x=state_xs, y=state_ys, name=state_names, imp_count = data ))# Maps the data value to a color color_mapper = LinearColorMapper(palette=colors, low=min(data), high=max(data))# Instantiating the figure p = figure( title=title, toolbar_location="left", plot_width=800, plot_height=450, tools=TOOLS )# Plotting the state-polygons on the figure p.patches('x', 'y', source=source, fill_color={'field': 'imp_count','transform': color_mapper}, fill_alpha=1.0, line_color="#884444", line_width=2, line_alpha=0.3)# Setting the legend for colors color_bar = ColorBar(color_mapper=color_mapper, ticker=BasicTicker(), label_standoff=12, border_line_color=None, location=(0,0)) p.add_layout(color_bar, 'right') hover = p.select_one(HoverTool) hover.point_policy ="follow_mouse" hover.tooltips = [ ("State", "@name"), ("Imprisonment rate (per 100k state pop)", "@imp_count") ] output_notebook() show(p)
3.2 Visualization Breakthrough!
Now that we’ve normalized the number of imprisoned people to the state populations, we can compare rates between states. From looking at these choropleths, it’s clear that there are massive differences between states. ### Observations * For both men and women over the two included years, Massachusetts has the lowest imprisonment rates (below 145 men per 100k state male pop. and below 10 women per 100k state female pop). * For men, Louisiana has the highest imprisonment rate (at least 740 men per 100k state male pop.). * Delaware stands out as having a much higher imprisonment rate that its neighbors. Delaware imprisons at least 660 men per 100k state male pop., which is 2 to 3 times more than any neighboring state. * Oklahoma has the highest imprisonment rate for women at over 75 women per 100k state female pop. * In general, southern states have higher male imprisonment rates than the north. * Except for Delaware, New England and the Midwest have lower than average female imprisonment rates. * Bokeh’s built-in state geometries are convenient, but they’re not great (just look at Michigan and the Great Lakes).
Calling our Choropleth-plotting function
title ="Number of Imprisoned Females per 100k Female State Population (2015)"make_choropleth(state_sex_join_df, '2015', 'Female_rate', title)
Loading BokehJS ...
Calling our Choropleth-plotting function
title ="Number of Imprisoned Females per 100k Female State Population (2016)"make_choropleth(state_sex_join_df, '2016', 'Female_rate', title)
Loading BokehJS ...
Calling our Choropleth-plotting function
title ="Number of Imprisoned Males per 100k State Male Population (2015)"make_choropleth(state_sex_join_df, '2015', 'Male_rate', title)
Loading BokehJS ...
Calling our Choropleth-plotting function
title ="Number of Imprisoned Males per 100k State Male Population (2016)"make_choropleth(state_sex_join_df, '2016', 'Male_rate', title)
Loading BokehJS ...
3.3 State Imprisonment Distributions by Gender
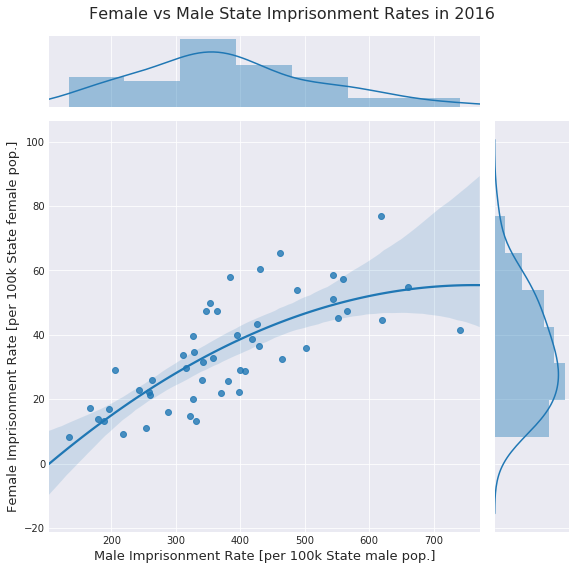
From the choropleths above (and from the prior notebook), we see that women are imprisoned at a far lower rate than men. But how does the ratio of female-to-male imprisonment rates vary by state?
We could get a sense of that by checking values between different states in same-year-different-gender choropleths above, but that’s slow and difficult, which means it’s a bad way to visualize this data. Scatter plots are much better at visualizing ratios for many different cases, and histograms are much better at quickly expressing the distribution of many observations of a single data feature (eg male imprisonment rates across states).
Encapsulating Seaborn plot-generating code in a function
def plot_male_v_female_by_state_sea(yr, df):with sns.axes_style("darkgrid"): tmp_df = df.loc[:,(yr, ['Male_rate','Female_rate'])][yr] g = sns.JointGrid(x="Male_rate", y="Female_rate", data=tmp_df, size=8) g.plot_joint(sns.regplot, order=2) g.plot_marginals(sns.distplot) plt.subplots_adjust(top=0.93) title ='Female vs Male State Imprisonment Rates in {}'.format(yr) g.fig.suptitle(title, fontsize=16) g.set_axis_labels('Male Imprisonment Rate [per 100k State male pop.]','Female Imprisonment Rate [per 100k State female pop.]', fontsize=13)
3.3.1 Static Scatter Plots with Distributions
The plots below (Seaborn’s JointGrid layout) combine both of these plots into a single visualization.
For both 2015 and 2016, we see that the bulk of imprisonment rates for women fall between 15 and 60 per 100k of respective state female population with a median rate of about 32 (per 100k state female pop.) and the bulk of imprisonment rates for men fall between 100 and 500 per 100k of respective state male pop. with a median rate around 350 (per 100k state male pop.).
We also see that there’s a fairly linear trend between the ratios of female-to-male imprisonment rates, meaning states that have a high male imprisonment rate also have a high female imprisonment rate, which could indicate that states’ criminal justice systems are consistent in how they treat women relative to how they treat men, or it could indicate actual differences in the rates at which men and women commit crime in different states. We would have to gather and explore more detailed data to explore these questions and possibly identify causal relationships.
Calling our plotting function to plot data for 2016 and 2016
/home/matt/miniconda3/envs/prisons_post_env/lib/python3.6/site-packages/matplotlib/axes/_axes.py:6462: UserWarning: The 'normed' kwarg is deprecated, and has been replaced by the 'density' kwarg.
warnings.warn("The 'normed' kwarg is deprecated, and has been "
Encapsulating Bokeh plot-generating code in a function
def plot_male_v_female_by_state(yr, df): mf_df = df.loc[:,(yr, ['Male_rate','Female_rate'])][yr] cdf = ColumnDataSource(mf_df) p = figure(plot_height=500, plot_width=500, tools="", toolbar_location=None, title="Female Imprisonment Rates vs Male Imprisonment Rates in {}" .format(yr)) p.background_fill_color="#f5f5f5" p.grid.grid_line_color="white" p.xaxis.axis_label ='Male Imprisonment Rate [per 100k State male pop.]' p.yaxis.axis_label ='Female Imprisonment Rate [per 100k State female pop.]' p.scatter(x='Male_rate', y='Female_rate', source=cdf, fill_alpha=0.6, size=12, line_color=None) p.add_tools(HoverTool( tooltips=[ ('State', '@Code'), ('Male Rate', '@Male_rate'), ('Female Rate', '@Female_rate'), ], )) output_notebook() show(p)
3.3.2 Interactive Scatter Plots
The plots above also show a regression curve that appears to deflect downward near the high end of the male imprisonment rates (mildly for 2015, and more significantly in 2016). From inspection, we see the state with the highest male imprisonment rate has a fairly average female imprisonment rate. From the choropleths above, we could (correctly) guess that this is Louisiana, but this highlights the fact that we have to cross-reference other data to identify the states, but that’s inconvenient if you’re just reading through this notebook on NBViewer. So I’ll replicate these plots with a library that allows me to reveal more information when you hover over a data point.
Now we can confirm the outlier data point is Louisiana. You can also see that, in 2015, Alaska (AK) had the highest female imprisonment rate, which was not revealed in the choropleth maps above because I removed Alaska and Hawaii to make the maps more compact. Comparing between years, we can see that Alaska’s imprisonment rates for both men and women dropped significantly while the ratio remained fairly average.
Calling our plotting function to plot data for 2016 and 2016
Good visualizations allow us to quickly see interesting trends and outliers that would otherwise be hidden in data. For example, while it is somewhat useful to know where the bulk of prisoners are located (Texas, California, and Florida), it’s more useful and interesting to see this data after we’ve controlled for state population. Interestingly, we see that Louisiana has a significantly higher imprisonment rate than any other state. Knowing this, we can target further research and questions about this. Per some brief independent research, I’ve found that Louisiana is one of two states that allow people to be convicted of felonies when only 10 of 12 jurors agree on guilt. This lower bar for conviction may be one of several causal factors driving Louisiana’s imprisonment rate, but it will take more data and research to strengthen that hypothesis.